Observability & Diagnostics
To read what a CobaltCore service operator is doing, start with the CR status, then inspect the event stream, and only then read the operator or service logs.
Prerequisites
Devstack
This guide is written against the Quick Start (Extended) devstack. Stand it up first:
kind create cluster --name cobaltcore --config hack/kind-config.yaml
make deploy-infra
Follow that tutorial through to its final Verify step, so the Keystone CR named keystone is Ready in the openstack namespace. The examples below use a Keystone CR as a representative service example, but the same workflow applies to other operators too.
Every controller surfaces state through the same three channels:
| Channel | Purpose | Primary audience |
|---|---|---|
| Print columns | One-line health summary for the CR | Humans, kubectl get |
| Status conditions | Structured, programmatic state | Automation, CI, alerts |
| Events | Timestamped audit trail of transitions | Humans investigating incidents |
Print columns
The exact CR kind varies by service, but the pattern stays the same:
kubectl get keystones -ANAMESPACE NAME READY ENDPOINT RELEASE AGE
openstack keystone True http://keystone.openstack.svc.cluster.local:5000/v3 2026.1 12m| Column | Source | Meaning |
|---|---|---|
READY | .status.conditions[?(@.type=='Ready')].status | Aggregate health |
ENDPOINT | .status.endpoint | Service API URL, if the CR exposes one |
RELEASE | .status.installedRelease | OpenStack release currently deployed |
AGE | .metadata.creationTimestamp | CR age |
Some services do not expose every field. In those cases, read the related status block instead of assuming the CR has the same shape as Keystone.
Status conditions
.status.conditions[] follows the standard Kubernetes pattern (type, status, reason, message, lastTransitionTime, observedGeneration). The aggregate Ready condition is the first thing to check. Each service adds its own subconditions for the phases that matter to it, such as secrets, deployment health, database sync, API readiness, network policy, or upgrade progress.
Read the condition tree for a specific CR:
kubectl get keystone keystone -n openstack \
  -o jsonpath='{range .status.conditions[*]}{.type}{"\t"}{.status}{"\t"}{.reason}{"\t"}{.message}{"\n"}{end}' \
  | column -t -s $'\t'
Or wait for one specific condition:
kubectl wait keystone/keystone -n openstack \
  --for=condition=DatabaseReady --timeout=5m
The exact condition names vary by operator. The main pattern is consistent:
Ready=False→ inspect the first false condition in the listSecretsReady=False→ check the backing Secret or external secret stateDatabaseReady=False→ inspect DB sync, schema, or migration statusDeploymentReady=False→ check rollout, probes, or image-pull issuesBootstrapReady=False→ the setup Job has not completed yet
Diagnosing a stuck CR
The first status=False condition from the top is usually the bottleneck. Work from the top of the list toward the bottom until the failure is explained.
Conditions of a ControlPlane
A ControlPlane reports an aggregate Ready over twenty-one sub-conditions, and the sub-conditions do not form one list. Seven belong to a blocking prefix, where the first False one is the bottleneck. The others belong to steps that all run on every pass, so several can be False at once, and each waits only for the conditions the figure draws an arrow from.
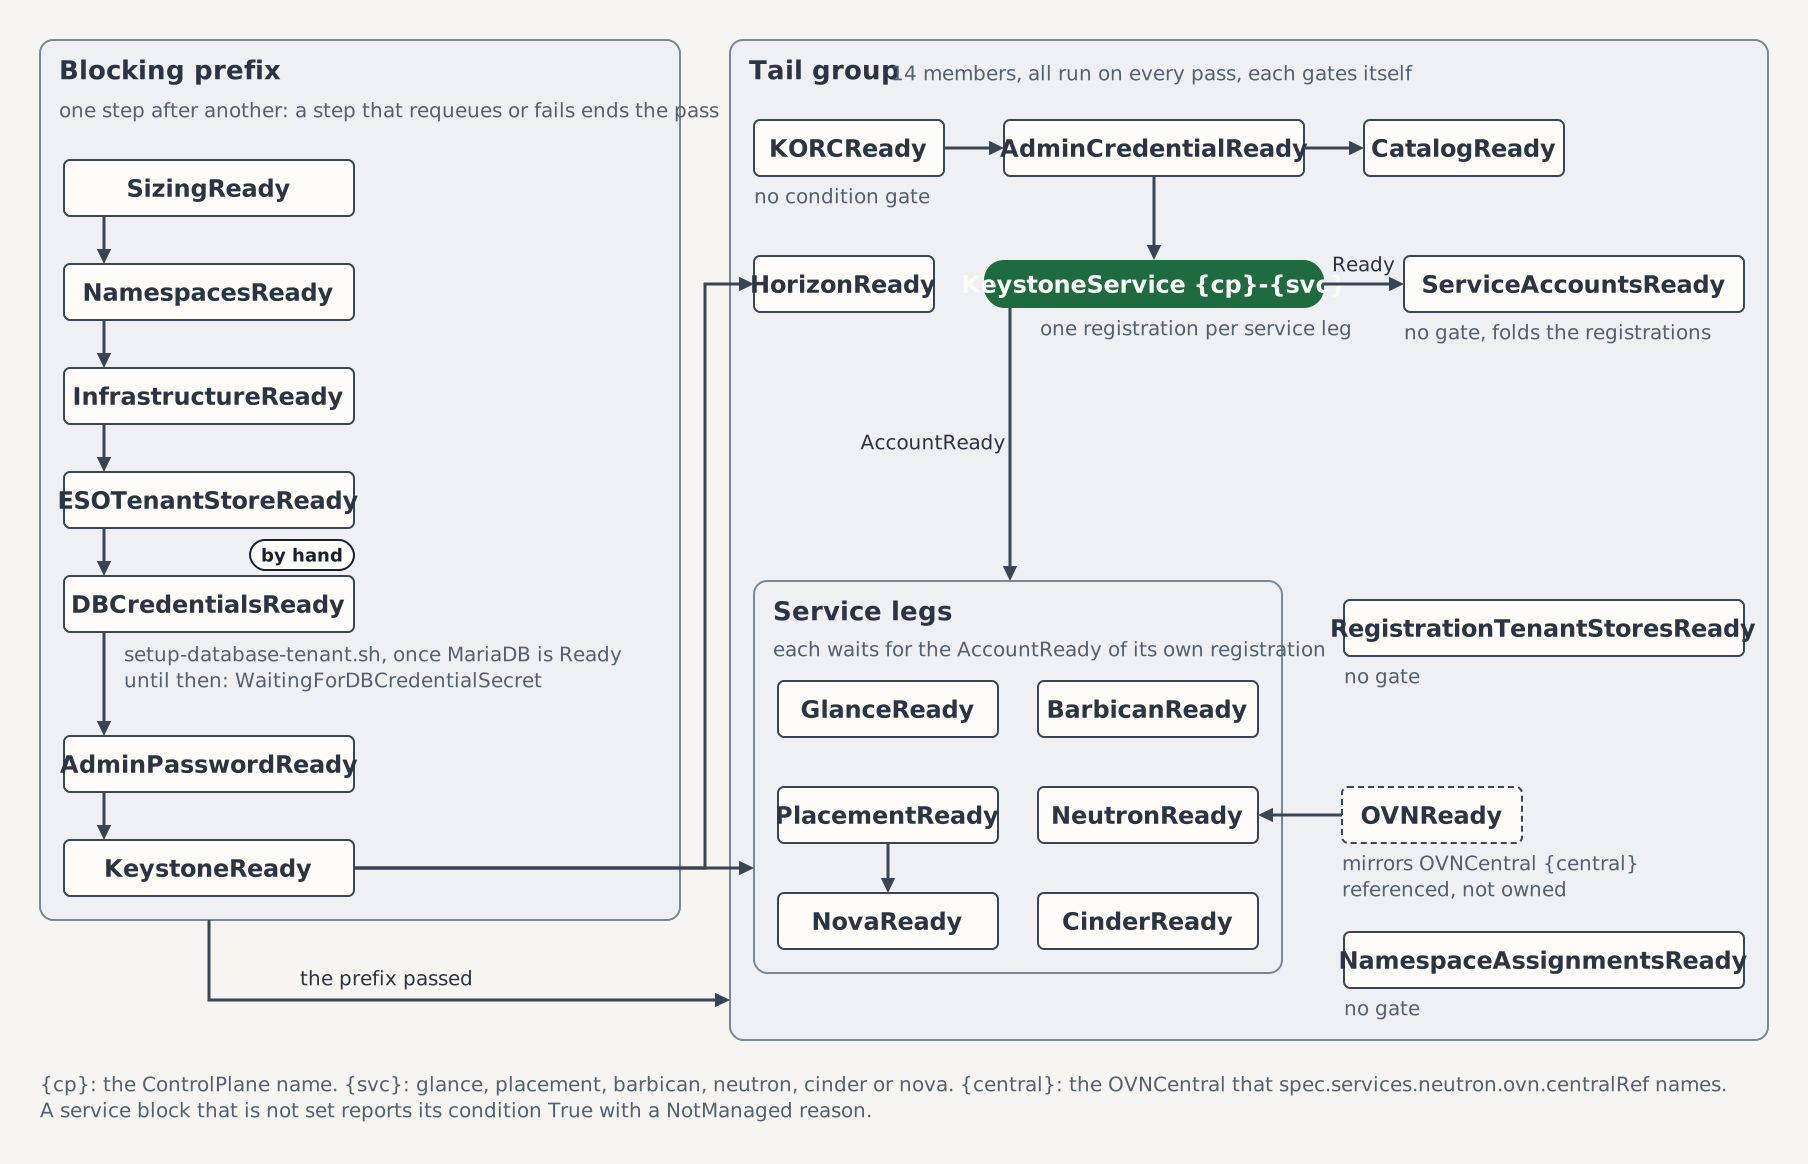
Reconciliation Flow lists every step with its gate, and Status Conditions has the reasons of each condition.
Upgrade status fields
Some services expose additional status fields during a release upgrade. The exact names and phase transitions vary by operator, but the pattern is similar to this:
| Field | Outside upgrade | During upgrade |
|---|---|---|
.status.installedRelease | Currently deployed release | Previous release (not yet changed) |
.status.targetRelease | "" | Target release |
.status.upgradePhase | "" | In progress, such as Expanding or Migrating |
Watch the upgrade live:
kubectl get keystone keystone -n openstack -w \
  -o custom-columns=NAME:.metadata.name,PHASE:.status.upgradePhase,FROM:.status.installedRelease,TO:.status.targetRelease
For the service-specific field semantics and phase model, read the controller's reference page and the day-2 guide for that service.
Events
Every lifecycle transition emits a Kubernetes Event with a stable reason. Events are deduplicated by object, reason, and message, so repeated reconciles do not spam the event stream.
Show everything for a CR
kubectl describe keystone keystone -n openstackThe Events section sits at the bottom of the output in reverse-chronological order. You can also view a timeline:
kubectl get events -n openstack \
  --field-selector involvedObject.kind=Keystone \
  --sort-by='.lastTimestamp'
The exact reason names are operator-specific. Use the controller event reference for the service you are debugging to map those reasons back to the underlying transition. For example, the full Keystone catalogue lives in Keystone Controller Events, and the other service operators have the same pattern in their own reference pages.
Service logs
For the workload itself, tail the service pods directly:
kubectl logs -n openstack -l app.kubernetes.io/name=keystone --tail=200 -fThe exact labels and log format vary by service. In general, the goal is the same: identify the last request that failed, the last error that was logged, and whether the app is reporting a dependency issue or a self-inflicted one.
As a concrete example, Keystone interleaves uWSGI access lines and oslo.log application records, which means you can answer both traffic-shape questions and request failure questions from the same pod stream. See Keystone Controller Events and the CRD reference for the service-specific logger configuration.
Controller logs
This is the last resort when the pattern is no longer visible in status or events. The key is to narrow the view to the affected object before reading a long log stream.
If status and events do not explain the failure, read the operator logs directly:
kubectl logs -n keystone-system -l app.kubernetes.io/name=keystone-operator \
  --tail=200 -f
The operator emits structured logr output, and each line carries the reconciled object and the sub-reconciler that produced it. Filter a specific CR:
kubectl logs -n keystone-system -l app.kubernetes.io/name=keystone-operator --tail=500 \
  | grep '"Keystone":"openstack/keystone"'
Further reading
- Keystone Controller Events: full event reason catalogue for the Keystone controller
- Keystone Reconciler Architecture: sub-reconciler contracts and watches
- Keystone Operator Prometheus Metrics: metric catalogue, labels, buckets, and sample PromQL
- Enable the Keystone operator metrics endpoint: start collecting service metrics and dashboards
- Day 2 Operations: putting observability into practice during scale, upgrade, and rotation
Tested by
The status, event, and log flow in this guide is asserted on the CI e2e kind cluster by the Keystone suites that cover the common operator pattern:
chainsaw test --test-dir tests/e2e/keystone/events
chainsaw test --test-dir tests/e2e/keystone/logging